Spring Boot Actuator module ships with spring boot that offers many out-of-the-box functionalities which help monitor and manage your spring boot applications. It provides production-ready features like health checks, HTTP traces, state of our database, metrics, etc. All this information can be exposed via HTTP or JMX endpoints using micrometer that you can interact with.
What’s Micrometer ?
Micrometer is a library and an open-source project that provides a metric facade that collects metrics from JVM-based applications and services, then send them to various monitoring systems like :
These monitoring systems provide you with excellent dashboards, graphs, and alerts that help you monitor your applications from one unified interface.
Micrometer is used by Actuator under the hood to expose metrics about your application. The main benefit of using Micrometer is that it allows you to switch between monitoring systems without changing your code. For example, if you start early with Prometheus, and then you want to switch to Datadog, you can do it without having to rewrite metrics code.
I’ll send the blog into two main parts :
- Part 1 : Explains you the steps that you can follow to configure actuator in your spring boot app and access its features over HTTP endpoints.
- Part 2 : Showcasing a actuel example of a admin dashboard created to monitor production spring boot app deployed on AWS. The dashboard is based on th metrics using javascript charting library Chart.js.
Part 1 : Why and how to configure Spring Boot Actuator
Once our Spring Boot application developed and deployed successfully to prod environment, we may lack some important information regarding the state of our application, how things are running to determine if the application is running smoothly or not. That’s why it’s crucial to implement monitoring practices to track and detect any potential issues, in addition to ensuring that the application remains healthy and efficient.
1. Enable Spring Boot Actuator and expose metrics over HTTP endpoints
First, we need to add the actuator dependency to our pom.xml file :
<dependencies>
	<dependency>
		<groupId>org.springframework.boot</groupId>
		<artifactId>spring-boot-starter-actuator</artifactId>
	</dependency>
</dependencies>
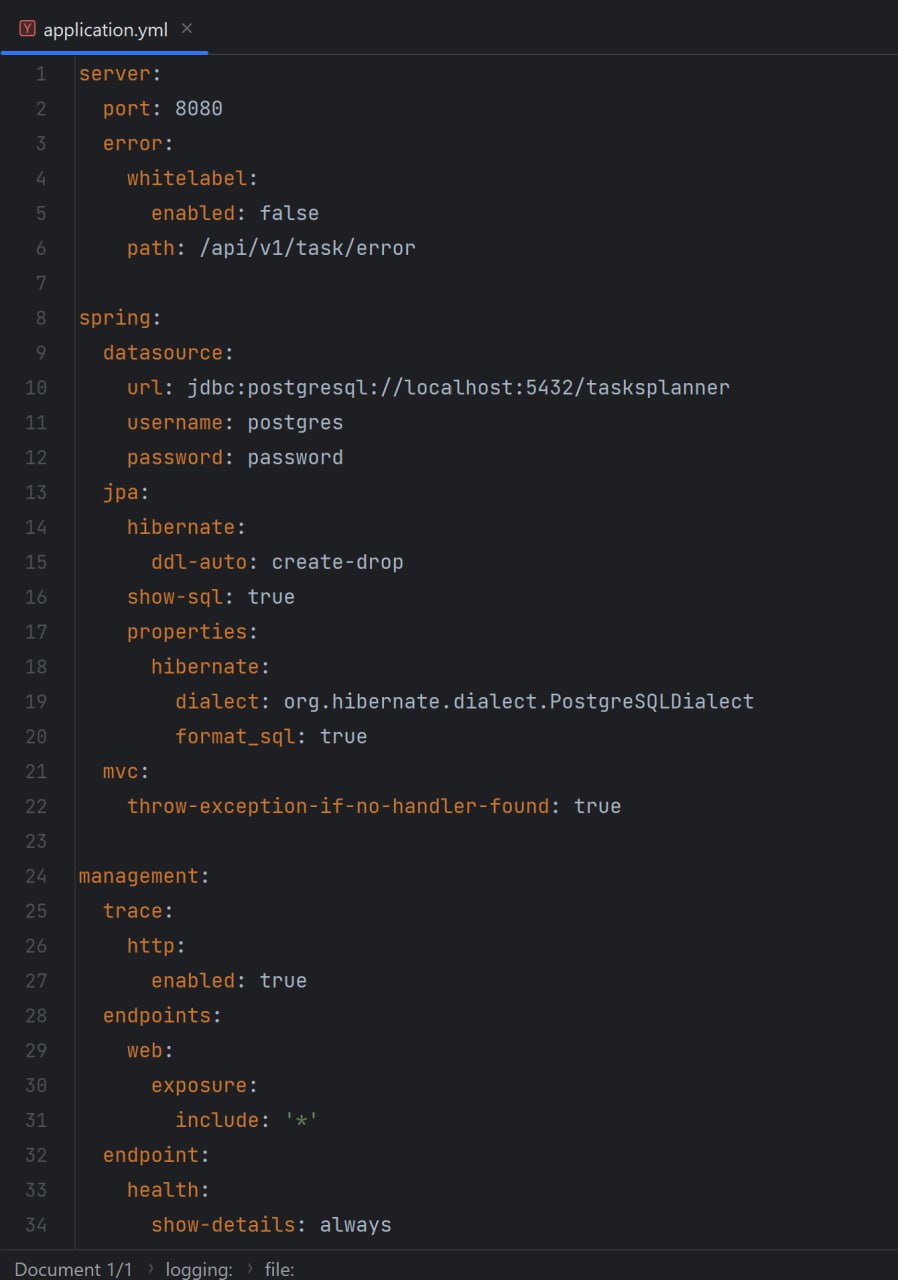
just by adding this dependency, we have access to all the features of actuator. But we need to expose some of them over HTTP endpoints. To do that, we need to add the following configuration in our application.yml / application.properties file :
# HTTP endpoints configuration
management.endpoints.web.exposure.include=*

# JMX endpoints configuration
management.endpoints.jmx.exposure.include=*
-
management.endpoints.web.exposure.include: This property allows us to expose some of the actuator features over HTTP endpoints. We can specify the features that we want to expose by separating them with a comma. Here are a few examples:management.endpoints.web.exposure.include=*: Exposes all endpoints over HTTPmanagement.endpoints.web.exposure.include=health,info: Exposes only the health and info endpoints over HTTPmanagement.endpoints.web.exposure.include=health,info,metrics: Exposes the health, info and metrics endpoints over HTTP
-
management.endpoints.jmx.exposure.include: This property allows us to expose actuator endpoints over JMX, with the same syntax as the previous property.
But before delving into how we can implement our proper metrics endpoints, let’s explore built-in endpoints and see what information they provide.
2. Actuator endpoints
Actuator provides a set of endpoints that expose information about your application. These endpoints are grouped into categories. Here are some of the most commonly used Actuator endpoints:
/actuator/health: Provides information about the health of your application, including whether it is up or down, and any details about its health status./actuator/info: Provides information about the application, such as the version of the application, name, description and so on./actuator/metrics: Provides information about various metrics related to your application, such as JVM memory usage, the number of requests, the number of active sessions, HTTP request timings, etc./actuator/loggers: Provides information about the loggers in your application, such as the log level, the effective log level, and the name of the logger.
You can see the full list of endpoints in the official documentation.
In addition to these built-in endpoints, actuator allows you to create custom endpoints that expose any information that you want. This gives the developers the ability to create their own custom endpoints to debug and monitor their applications.
3. Custom Actuator Endpoints
3.1. Custom Health Actuator
The default Spring Boot Actuator health check provides basic health information about the application, such as whether it is up and running. However, you may want to create custom health checks to provide application-specific health information. For example, let’s say that we want to monitor the health of our database. We can achieve that by creating a custom health indicator. A health indicator is a class that implements the HealthIndicator interface which returns the health status of the application. Here is an example of a custom health indicator for database status:
@Component
public class DatabaseHealthIndicator implements HealthIndicator {

	@Autowired
	private DataSource dataSource;

	@Override
	public Health health() {
		if (isDatabaseUp()) {
			return Health.up().withdetail("database", "up").build();
		} else {
			return Health.down().withdetail("database", "down").build();
		}
	}

	private boolean isDatabaseUp() {
		try (Connection connection = dataSource.getConnection()) {
			return true;
		} catch (Exception e) {
			return false;
		}
	}
}
3.2. Custom Actuator Endpoint with @Endpoint annotation
Apart from the predefined endpoints, it is possible to develop customized endpoints to expose the desired information. This is useful when you want to expose more application details that are not provided by the default endpoints.
This can be achieved by annotating the class with @Endpoint. Here is an example of a custom endpoint that returns the list of information about the server :
@Endpoint(id = "custom")
@Component
public class CustomEndpoint {

	@ReadOperation
	public List<String> invoke() {
		List<String> serverInfos = new ArrayList<>();
		info.add("Server Name : " + System.getProperty("os.name"));
		info.add("Server Version : " + System.getProperty("os.version"));
		info.add("Server Architecture : " + System.getProperty("os.arch"));
		return serverInfos;
	}
}
ℹ️ Besides The
@Endpointannotation we can specify endpoint operations using@ReadOperation,@WriteOperation, and@DeleteOperation, which are used to define HTTP methods for the endpoint (GET, POST, and DELETE respectively).
Part 2 : Build Admin Dashboard with Spring Boot Actuator and Angular
To showcase how we can implement actuator to build an admin dashboard, I have used an example from a side project, which is a minimalist collaborative task management app that allows users to manage and supervise their tasks in a team and receive notifications when a task is assigned to them using discord webhooks. You can find the source code of the project on Github Repo
1. Building Backend API
First, as previously mentioned in the first part, we need to add spring boot actuator dependency to our pom.xml and enable it in the application’s configuration.
Then, we need to create a new Angular project using the Angular CLI. To do that, open a terminal and run the following command :
ng new admin-dashboard
Now that we have Spring Boot Actuator and Angular set up, we can start building the admin dashboard. Here are the steps involved:
First, we need to build the backend API using Spring Boot Actuator. We’ll use the built-in /actuator endpoint to expose our application’s metrics and other operational data using custom endpoints.
1.1. Buil-in Actuator Endpoints
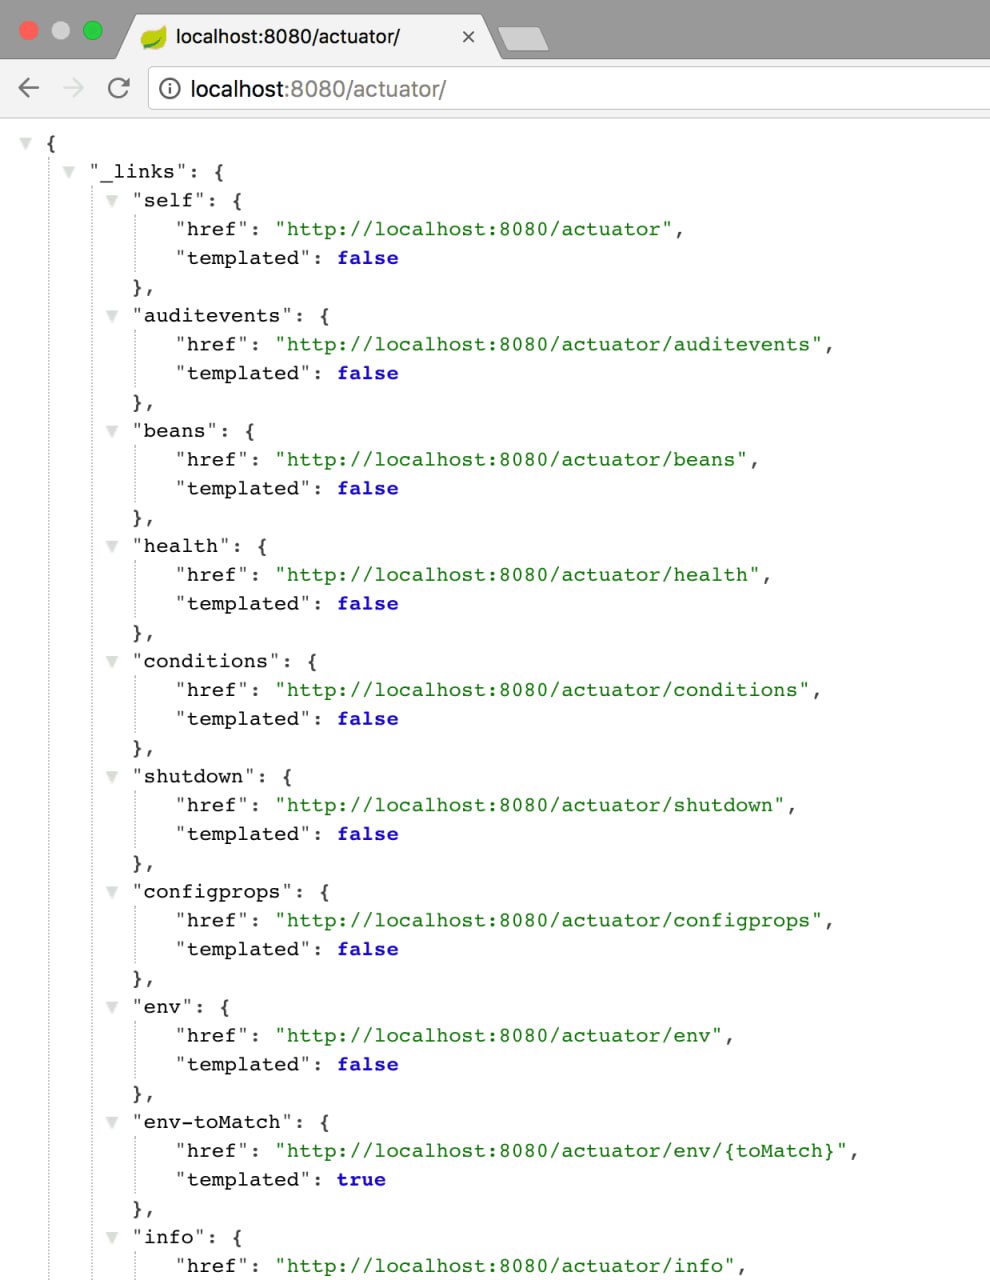
You run the following URL in the browser : http://localhost:8080/actuator
Example : Info Endpoint
- One of the information that we can get from the built-in endpoints is the application info based on the
infoproperty in theapplication.propertiesfile :
info.app.name=Tasks Planner App
info.app.description=Minimalist collaborative task management app
info.app.version=1.0.0
- By adding the info property, compiling the application again, and navigating to the actuator URL http://localhost:8080/actuator/info in a web browser, we get the following JSON output :
{
  "app": {
	"name": "Tasks Planner App",
	"description": "Minimalist collaborative task management app",
	"version": "1.0.0"
  }
}
1.2. Custom Actuator Endpoint
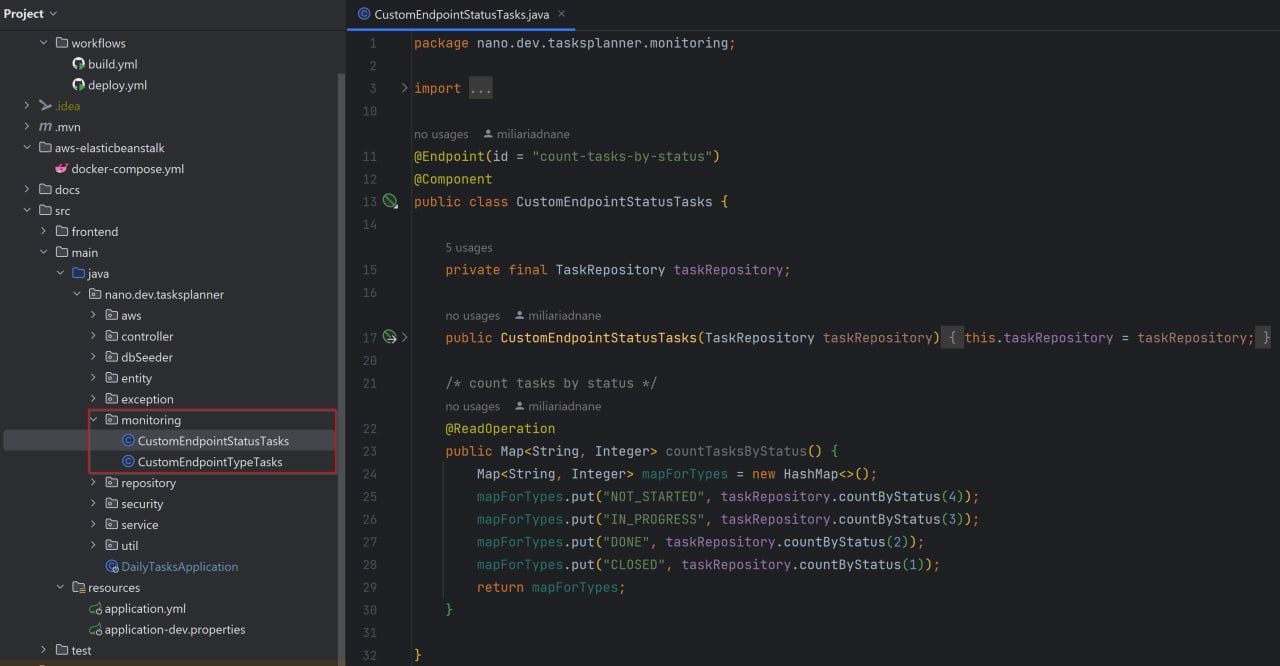
The above image shows the custom endpoint that we have created that counts the number of tasks based on their status.
2. Building Frontend with Angular and Chart.js
Now that we have our backend API set up, we can build the frontend using Angular and Chart.js. We’ll create a new Angular component called MonitoringComponent to display the metrics data. Here is the step-by-step process:
- Create Angular Component
Open a terminal and run the following command :
ng generate component monitoring
- Add Chart.js
To add Chart.js to our Angular project, we need to install the chart.js library. To do that, open a terminal and run the following command :
npm install chart.js --save
- Create Monitoring Service, which will be responsible for fetching data from our backend API using the
HttpClientmodule :
import { SystemCpu } from './../interfaces/system-cpu';
import { SystemHealth } from './../interfaces/system-health';
import { HttpClient } from '@angular/common/http';
import { Observable } from 'rxjs';
import { Injectable } from '@angular/core';
import { environment } from 'src/environments/environment.prod';

@Injectable({
  providedIn: 'root'
})
export class MonitoringService {

  constructor(private http: HttpClient) {}

  public getSystemHealth(): Observable<SystemHealth> {
    return this.http.get<SystemHealth>(`${environment.actuatorUrl}/health`);
  }

  public getSystemCpu(): Observable<SystemCpu> {
    return this.http.get<SystemCpu>(`${environment.actuatorUrl}/metrics/system.cpu.count`);
  }

  public getProcessUptime(): Observable<any> {
    return this.http.get<any>(`${environment.actuatorUrl}/metrics/process.uptime`);
  }

  public getHttpTraces(): Observable<any> {
    return this.http.get<any>(`${environment.actuatorUrl}/httptrace`);
  }

  public countTasksByType(): Observable<any> {
    return this.http.get<any>(`${environment.actuatorUrl}/count-tasks-by-type`);
  }

  public countTasksByStatus(): Observable<any> {
    return this.http.get<any>(`${environment.actuatorUrl}/count-tasks-by-status`);
  }
}
- In the
MonitoringComponentHTML template, we’ll add acanvaselement to display the charts :
<div class="chart">
  <canvas id="pieChart-TasksByStatus"></canvas>
</div>

<div class="chart">
  <canvas id="pieChart-TasksByType"></canvas>
</div>
- Finally, we’ll initialize the chart.js in the
MonitoringComponentTypeScript file :
private pieChart1Init(): Chart {
    const element = document.getElementById('pieChart-TasksByType');
    return new Chart(element, {
      type: 'pie',
      data: {
          labels: ['Feature', 'Bug', 'Improvement', 'Test', 'Documentation'],
          datasets: [{data: [this.nmbrOfFeatures, this.nmbrOfBugs, this.nmbrOfImprovements, this.nmbrOfTests, this.nmbrOfDocumentations],
            backgroundColor: ['#2cd07e80', '#ff505080', '#2cabe380', '#ffc107', '#361a0a'],
            borderColor: ['#2cd07e80', '#ff505080', '#2cabe380', '#ffc107', '#361a0a'],
            borderWidth: 3
          }]
      },
      options: {
        legend: { display: true },
        display: true
      }
    });
}

private pieChart2Init(): Chart {
    const element = document.getElementById('pieChart-TasksByStatus');
    return new Chart(element, {
      type: 'pie',
      data: {
          labels: ['Not Started', 'In progress', 'Done', 'Closed'],
          datasets: [{data: [this.notStarted, this.inProgress, this.done, this.closed],
            backgroundColor: ['#2cd07e80', '#ff505080', '#2cabe380', '#ffc107', '#361a0a'],
            borderColor: ['#2cd07e80', '#ff505080', '#2cabe380', '#ffc107', '#361a0a'],
            borderWidth: 3
          }]
      },
      options: {
        legend: { display: true },
        display: true
      }
    });
}
Note: The above code is just a snippet of the
MonitoringComponentTypeScript file. You can find the full code on my github repo. Also, we’re supposed to use thengOnInit()lifecycle hook to initialize the charts for the above code example.
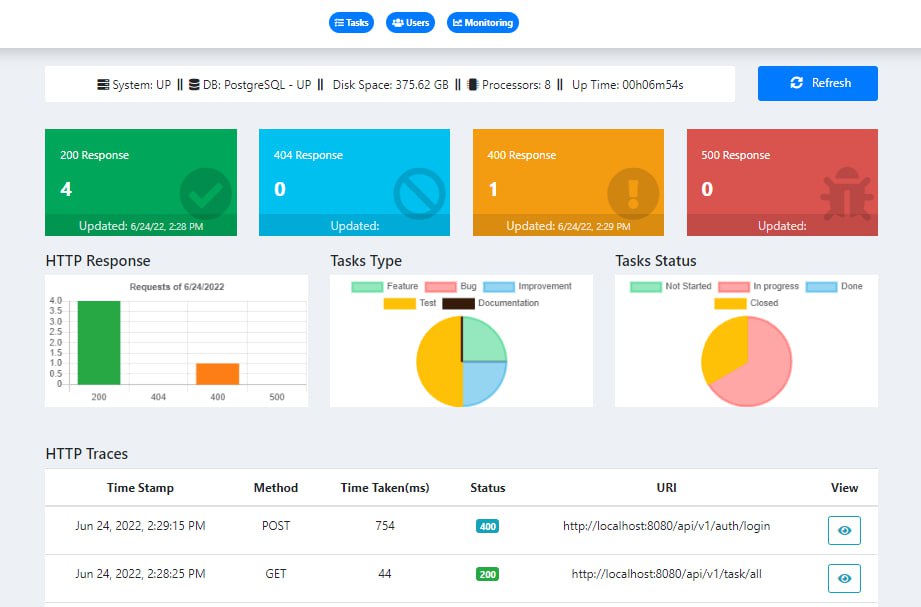
Final Result
That all folks! I hope you enjoyed it and learned something new. If you have any questions, feel free to ask them in the comments section below.